year = 1952.95 + 1.24 (age, years)
year = 2078.40 + -2.78 (bust, inches)
year = 1919.24 + 2.60 (waist, inches)
year = 2090.05 + -3.16 (hips, inches)
year = 1980.38 + -0.004 (weight, pounds)
year = 1847.13 + 2.01 (height, inches)
Multiple Regression Models
On Playboy ModelsOr
*everything you ever wanted to know about Playboy Playmates, but never bothered to ask.
Jason "Hef" Brauner
Multivariate Statistics
Spring 2001
The Task: Find the story in the data.
The Tool: Multivariate regression analysis.
The Data: Well, sometimes things work out in ways you could never expected.Given that this was election year, I thought, "The media have been spouting election models for the past 12 months. Let me see if I can put some of these to the test."
The World Wide Web being the vast repository of digital data it is, I tried looking for numbers concerning the heights, weights, etc. of the presidents. We've all heard these "rules" that "the taller candidate wins" and all such as that, so I had intended to model these to a percentage of the popular vote. But that's not what the Web is for.
I found these data instead.
And here is the story they tell. Read on.
From isolated (but frequent!) sampling of issues of Playboy Magazine, it is apparent that the overall "look" of the models featured as Playmates has changed over the years. It is my hypothesis that there is a relationship between the passage of time and the individual attributes (age, bust, waist, hips, weight, and height).Note that pictures of models are often taken several months to years before they are ever published, thus, the date of publication of a particular model reflects the opinion of the editors of the magazine regarding the overall appeal of a particular model.
A second goal to be achieved through this data set is to develop a model which would:
1) Describe the influence of the aforementioned predictor variables in which year pictures of models were published.
2) Predict when a photo shoot of a model might conceivably be published.
Biometric information about Playboy Playmates was extracted from a the web site "Playboy Playmate Data Statistics" and formatted in such a manner to perform statistical analyses. This information concerned the height, weight, age, bust, waist, and hips of each model (all of which were continuous variables). These data were recorded with the date of publication of each issue in which the model appeared.Data on the web site ranged from the entire series of publications of Playboy magazine (1953 to present). However, measurements of models were recorded and/or reported inconsistently in the earliest issues of Playboy. Therefore, observations prior to 1959 were excluded because these (sex) objects lacked data for one or more of the variables analyzed in this paper. As a result, of the total of 572 Playmates who have been featured in Playboy, 499 were included for analysis. Thus 87.2% of the Playmate "universe" was sampled.
The height data required some manipulation in order to perform the analyses. Specifically, measurements were initially reported in feet with remaining inches. These were transformed to total inches (e.g., 5' 10" -> 60" + 10" -> 70"). This was accomplished via the "search and replace" function in Microshaft Word.
All statistical analyses were accomplished via SAS v. 8.1.
Simple Linear Regression
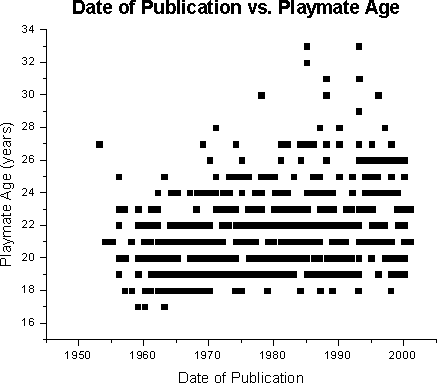
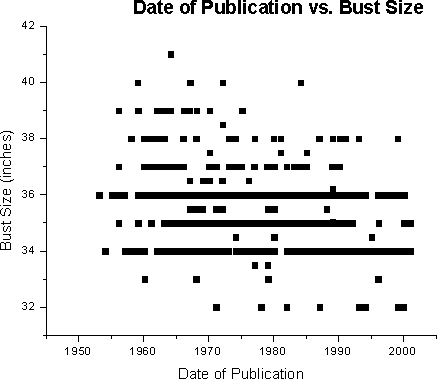
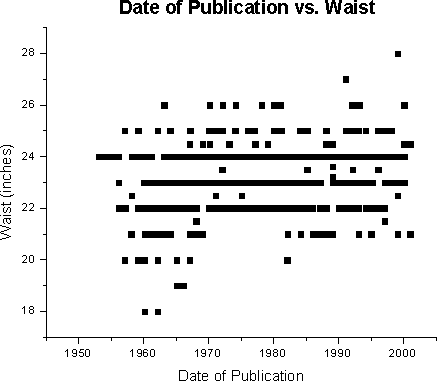
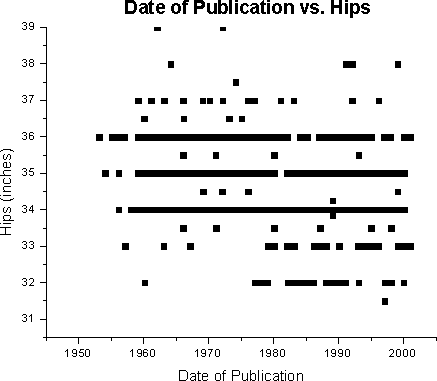
Prior to developing a multivariate regression model, simple linear regression (SLR) was employed to determine the relationships between the year and the following variables age, bust, waist, hips, weight, and height.Below are scatterplots of raw data of the individual variables; the regression line itself is not plotted. Note some data points are not shown as many completely overlap near or identical values. With each scatterplot, SLR models are reported with significance level and R2.
|
For age (p <0.0001, R2 =
0.0735):
year = 1952.95 + 1.24 (age, years) |
|
For bust (p <0.0001, R2
= 0.1153):
year = 2078.40 + -2.78 (bust, inches) |
|
For waist (p <0.0001, R2
= 0.0755):
year = 1919.24 + 2.60 (waist, inches) |
|
For hips (p <0.0001, R2
= 0.0983):
year = 2090.05 + -3.16 (hips, inches) |
|
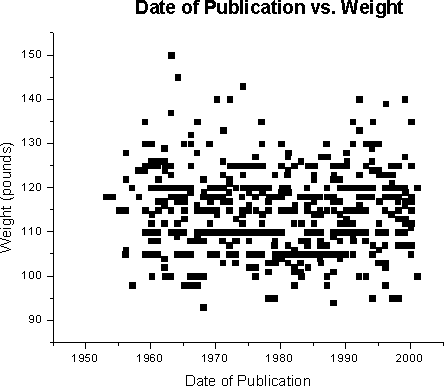
For weight (p <0.0001, R2
= 0.0000):
year = 1980.38 + -0.004 (weight, pounds) |
|
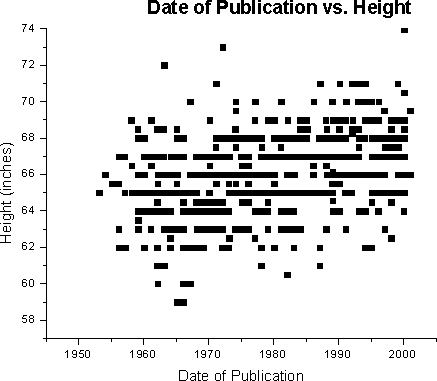
For height (p <0.0001, R2
= 0.1466):
year = 1847.13 + 2.01 (height, inches) |
The Correlation Matrix
A correlation matrix was generated to determine the magnitude of the relationships between the predictors.
Of the 15 possible pairwise combinations of predictors, 13 were significant at an alpha level of 0.05.For statistically significant correlations between pairs of variables, R (absolute value) and its corresponding p are reported.
The Multivariate Model
Both the Stepwise Forward and Backward and the Maximum R2 methods yielded the same highly significant (p < 0.0001, R2 = 0.4807) model.year = 1909.06 + 0.621*age - 1.17191*bust + 3.24521*waist - 3.21603*hips - 0.40623*weight + 2.75089*height
Both methods provided the same coefficients for all predictors. For both methods, the predictors were added in the same order and all six were used in the final model.
Beta Coefficients
These scores indicate the relative (not the absolute) contribution of each variable to the model.Variable Beta Coefficient
age 0.13539
bust 0.14323
waist 0.34238
hips 0.31868
weight 0.30739
height 0.52400
One unexpected finding was the complete absence of a significant change (p = 0.9510) in the weight of the Playmates over the history of the publication. This can be explained by the highly statistically significant (p < 0.0001) contradicting influences of an increase in height and waist line with declining bust and hip measurements. In effect they grew taller and less shapely over the years.The relatively low predictive value of the model (R2 = 0.4807) was likely due to several factors.
Naturally, the development of the model was limited to the variables for which data were collected. Other predictor variables which might have influenced the likelihood of publication of photos of a particular model include the race/ethnicity/skin tone, hair length and color, facial features such as eye color, shape of lips, etc.
Still other variables are hard to quantify. For example, from time to time Playboy has published pictorials of some women because of a popularity outside of their appeal strictly as nude models, such as actresses and musicians.
Other potential predictors might also include those which were derived from other absolute variables. For example, in dealing with the topic of feminine beauty, absolutes are often of less concern than are proportions. Therefore, better indicators of the likelihood of publication might be those which were derived from ratios of height:weight and/or bust:waist:hips and/or other combinations. Several of these alternate models were attempted via the Maximum R2 method with the following results:
When height and weight were replaced with htwt (ratio of ht:wt) the following highly significant model (p < 0.0001, R2 = 0.3678) was produced:
year = 2045.63 + 0. 888*age - 1.433*bust + 4.397*waist - 3.145*hips - 15.731*htwt
When bust, waist, and hips were replaced with bwh (ratio of bust:waist:hips) the following highly significant model (p < 0.0001, R2 = 0.3408) was produced:year = 1827.64 + 0. 758*age - 11058*bwh - 0.649*weight + 3.541*height
When bust, waist, and hips were replaced with bw (ratio of bust:waist) and bh (ratio of bust:hips) the following highly significant model (p < 0.0001, R2 = 0.4570) was produced:year = 1856.36 + 0. 643*age - 54.809*bw - 62.036*bh - 0.657*weight + 3.106*heightWhen height and weight were replaced with htwt (ratio of ht:wt) and bust, waist, and hips were replaced with bwh (ratio of bust:waist:hips) the following highly significant model (p < 0.0001, R2 = 0.1797) was produced:year = 2040.03 + 1.107*age - 21.303*bwh - 21990*htwt
Note that the R2 for all of these manipulations was less than that of the original model which included all of the variables. It is therefore reasonable to conclude that all the individual predictors are indeed relevant in determining whether or not a pictorial will be published. However, these factors are only a portion of the predictors.
Kachigan, Sam Kach. 1991. Multivariate Statistical Analysis: A Conceptual Introduction. Radius Press, New York.Playboy Playmate Data Statistics By Year. 2001. http://members.home.net/sedford/pmdatamain.html (now defunct)
StatSoft, Inc. 2001. http://www.statsoft.com/textbook/stathome.html
*Jason Brauner;
*Regression Models on Playboy Models;
data playmates;
input year age bust waist hips wt ht @@;
cards;
*normality tests on untransformed variables;
proc univariate normal plot;
var age;
by year;
proc univariate normal plot;
var bust;
by year;
proc univariate normal plot;
var waist;
by year;
proc univariate normal plot;
var hips;
by year;
proc univariate normal plot;
var wt;
by year;
proc univariate normal plot;
var ht;
by year;
*simple regression models of each of the
individual variates;
proc reg;
model year = age;
proc reg;
model year = bust;
proc reg;
model year = waist;
proc reg;
model year = hips;
proc reg;
model year = wt;
proc reg;
model year = ht;
*correlation matrix;
proc corr pearson;
var age bust waist hips wt ht;
*multiple regression via Maximum R^2 method;
proc reg;
model year = age bust waist hips
wt ht / selection = maxr;
*generation of all possible r^2 and R^2
values;
proc reg;
model year = age bust waist hips
wt ht / selection = rsquare;
*beta coefficients from the 6 indep var
model;
proc reg simple;
model wins = age bust waist hips
wt ht / stb;
*beta coefficients from the 5 indep var
model ("weight" was removed);
proc reg simple;
model wins = age bust waist hips
ht / stb;
*multiple regression via the stepwise forward
method;
proc reg;
model year = age bust waist hips
wt ht / selection = forward;
*multiple regression via the stepwise backward
method;
proc reg;
model year = age bust waist hips
wt ht / selection = backward;
run;
The REG Procedure
Model: MODEL1
Dependent Variable: year
Analysis of Variance
Sum of Mean
Source
DF Squares
Square F Value Pr > F
Model
<.0001
Error
Corrected Total
Root MSE
R-Square 0.0735
Dependent Mean Adj
R-Sq 0.0716
Coeff Var
0.59067
Parameter Estimates
Parameter Standard
Variable DF
Estimate Error
t Value Pr > |t|
Intercept <.0001
age <.0001
The REG Procedure
Model: MODEL1
Dependent Variable: year
Analysis of Variance
Sum of Mean
Source
DF Squares
Square F Value Pr > F
Model
<.0001
Error
Corrected Total
Root MSE
R-Square 0.1153
Dependent Mean Adj
R-Sq 0.1135
Coeff Var
0.57719
Parameter Estimates
Parameter Standard
Variable DF
Estimate Error
t Value Pr > |t|
Intercept <.0001
bust <.0001
The REG Procedure
Model: MODEL1
Dependent Variable: year
Analysis of Variance
Sum of Mean
Source
DF Squares
Square F Value Pr > F
Model
<.0001
Error
Corrected Total
Root MSE
R-Square 0.0755
Dependent Mean Adj
R-Sq 0.0736
Coeff Var
0.59003
Parameter Estimates
Parameter Standard
Variable DF
Estimate Error
t Value Pr > |t|
Intercept <.0001
waist <.0001
The REG Procedure
Model: MODEL1
Dependent Variable: year
Analysis of Variance
Sum of Mean
Source
DF Squares
Square F Value Pr > F
Model
<.0001
Error
Corrected Total
Root MSE
R-Square 0.0983
Dependent Mean Adj
R-Sq 0.0965
Coeff Var
0.58271
Parameter Estimates
Parameter Standard
Variable DF
Estimate Error
t Value Pr > |t|
Intercept <.0001
hips <.0001
The REG Procedure
Model: MODEL1
Dependent Variable: year
Analysis of Variance
Sum of Mean
Source
DF Squares
Square F Value Pr > F
Model
Error
Corrected Total
Root MSE
R-Square 0.0000
Dependent Mean Adj
R-Sq -0.0020
Coeff Var
0.61364
Parameter Estimates
Parameter Standard
Variable DF
Estimate Error
t Value Pr > |t|
Intercept <.0001
wt
The REG Procedure
Model: MODEL1
Dependent Variable: year
Analysis of Variance
Sum of Mean
Source
DF Squares
Square F Value Pr > F
Model
<.0001
Error
Corrected Total
Root MSE
R-Square 0.1466
Dependent Mean Adj
R-Sq 0.1448
Coeff Var
0.56690
Parameter Estimates
Parameter Standard
Variable DF
Estimate Error
t Value Pr > |t|
Intercept <.0001
ht <.0001
The CORR Procedure
6 Variables: age bust waist hips wt ht
Simple Statistics
Variable
N Mean
Std Dev Sum
Minimum Maximum
age
bust
waist
hips
wt
ht
Pearson Correlation Coefficients, N = 499
Prob > |r| under H0: Rho=0
age bust waist hips wt ht
age
<.0001
bust
-
0.0592
<.0001 <.0001
<.
waist
0.0024 <.0001
<.0001 <.0001
<.0001
hips
0.9978 <.0001
<.0001
<.0001 <.0001
wt
0.0474 <.0001
<.0001 <.0001
<.0001
ht
<.
<.0001 <.0001
<.0001
The REG Procedure
Model: MODEL1
Dependent Variable: year
Maximum R-Square Improvement: Step 1
Variable ht Entered: R-Square = 0.1466 and C(p) =
Analysis of Variance
Sum of Mean
Source
DF Squares
Square F Value Pr > F
Model
<.0001
Error
Corrected Total
Parameter Standard
Variable Estimate
Error Type II SS F Value Pr > F
Intercept <.0001
ht
<.0001
Bounds on condition number: 1, 1
-----------------------------------------------------------------------------------------------
The above model is the best 1-variable model found.
Maximum R-Square Improvement: Step 2
Variable hips Entered: R-Square = 0.3319 and C(p) =
Analysis of Variance
Sum of Mean
Source
DF Squares
Square F Value Pr > F
Model
<.0001
Error
Corrected Total
Parameter Standard
Variable Estimate
Error Type II SS F Value Pr > F
Intercept <.0001
hips -
<.0001
ht
<.0001
Bounds on condition number: 1.0757, 4.3028
-----------------------------------------------------------------------------------------------
The above model is the best 2-variable model found.
Maximum R-Square Improvement: Step 3
Variable waist Entered: R-Square = 0.4052 and C(p) = 72.5739
Analysis of Variance
Sum of Mean
Source
DF Squares
Square F Value Pr > F
Model
<.0001
Error
Corrected Total
Parameter Standard
Variable Estimate
Error Type II SS F Value Pr > F
Intercept <.0001
waist <.0001
hips -
<.0001
ht
<.0001
Bounds on condition number: 1.3741, 11.466
-----------------------------------------------------------------------------------------------
The above model is the best 3-variable model found.
Maximum R-Square Improvement: Step 4
Variable wt Entered: R-Square = 0.4475 and C(p) = 34.4984
Analysis of Variance
Sum of Mean
Source
DF Squares
Square F Value Pr > F
Model
<.0001
Error
Corrected Total
Parameter Standard
Variable Estimate
Error Type II SS F Value Pr > F
Intercept <.0001
waist <.0001
hips - <.0001
wt - <.0001
ht
<.0001
Bounds on condition number: 3.616, 36.948
-----------------------------------------------------------------------------------------------
The above model is the best 4-variable model found.
Maximum R-Square Improvement: Step 5
Variable age Entered: R-Square = 0.4672 and C(p) = 17.8148
Analysis of Variance
Sum of Mean
Source
DF Squares
Square F Value Pr > F
Model
<.0001
Error
Corrected Total
Parameter Standard
Variable Estimate
Error Type II SS F Value Pr > F
Intercept <.0001
age <.0001
waist <.0001
hips - <.0001
wt - <.0001
ht
<.0001
Bounds on condition number: 3.634, 51.955
The above model is the best 5-variable model found.
Maximum R-Square Improvement: Step 6
Variable bust Entered: R-Square = 0.4807 and C(p) = 7.0000
Analysis of Variance
Sum of Mean
Source
DF Squares
Square F Value Pr > F
Model
<.0001
Error
Corrected Total
Parameter Standard
Variable Estimate
Error Type II SS F Value Pr > F
Intercept <.0001
age <.0001
bust -
waist <.0001
hips - <.0001
wt - <.0001
ht
<.0001
The REG Procedure
Model: MODEL1
Dependent Variable: year
Maximum R-Square Improvement: Step 6
Bounds on condition number: 3.9451, 75.099
-----------------------------------------------------------------------------------------------
The above model is the best 6-variable model found.
No further improvement in R-Square is possible.
The REG Procedure
Model: MODEL1
Dependent Variable: year
R-Square Selection Method
Number in
Model R-Square Variables
in Model
ht
bust
hips
waist
age
wt
---------------------------------------------------
hips ht
wt ht
bust ht
waist hips
bust waist
age ht
age bust
age hips
waist ht
hips wt
bust wt
bust hips
age waist
waist wt
age wt
---------------------------------------------------
waist hips
ht
waist wt
ht
bust hips
ht
age hips
ht
hips wt
ht
bust wt
ht
age waist
hips
age wt ht
bust waist
ht
bust waist
hips
age bust
ht
waist hips
wt
age bust
waist
bust waist
wt
bust hips
wt
age hips
wt
age bust
hips
age waist
ht
age bust
wt
age waist
wt
---------------------------------------------------
waist hips
wt ht
bust waist
hips ht
age waist
hips ht
bust waist
wt ht
age waist
wt ht
age bust
hips ht
age hips
wt ht
bust hips
wt ht
age bust
wt ht
age bust
waist hips
age bust
waist ht
bust waist
hips wt
age waist
hips wt
age bust
waist wt
age bust
hips wt
---------------------------------------------------
age waist
hips wt ht
bust waist
hips wt ht
age bust
waist hips ht
age bust
waist wt ht
age bust
hips wt ht
age bust
waist hips wt
---------------------------------------------------
age bust
waist hips wt ht
The REG Procedure
Model: MODEL1
Dependent Variable: year
Forward Selection: Step 1
Variable ht Entered: R-Square = 0.1466 and C(p) =
Analysis of Variance
Sum of Mean
Source
DF Squares
Square F Value Pr > F
Model
<.0001
Error
Corrected Total
Parameter Standard
Variable Estimate
Error Type II SS F Value Pr > F
Intercept <.0001
ht
<.0001
Bounds on condition number: 1, 1
-----------------------------------------------------------------------------------------------
Forward Selection: Step 2
Variable hips Entered: R-Square = 0.3319 and C(p) =
Analysis of Variance
Sum of Mean
Source
DF Squares
Square F Value Pr > F
Model
<.0001
Error
Corrected Total
Parameter Standard
Variable Estimate
Error Type II SS F Value Pr > F
Intercept <.0001
hips -
<.0001
ht
<.0001
Bounds on condition number: 1.0757, 4.3028
-----------------------------------------------------------------------------------------------
Forward Selection: Step 3
Variable waist Entered: R-Square = 0.4052 and C(p) = 72.5739
Analysis of Variance
Sum of Mean
Source
DF Squares
Square F Value Pr > F
Model
<.0001
Error
Corrected Total
Parameter Standard
Variable Estimate
Error Type II SS F Value Pr > F
Intercept <.0001
waist <.0001
hips -
<.0001
ht
<.0001
Bounds on condition number: 1.3741, 11.466
-----------------------------------------------------------------------------------------------
Forward Selection: Step 4
Variable wt Entered: R-Square = 0.4475 and C(p) = 34.4984
Analysis of Variance
Sum of Mean
Source
DF Squares
Square F Value Pr > F
Model
<.0001
Error
Corrected Total
Parameter Standard
Variable Estimate
Error Type II SS F Value Pr > F
Intercept <.0001
waist <.0001
hips - <.0001
wt - <.0001
ht
<.0001
Bounds on condition number: 3.616, 36.948
-----------------------------------------------------------------------------------------------
Forward Selection: Step 5
Variable age Entered: R-Square = 0.4672 and C(p) = 17.8148
Analysis of Variance
Sum of Mean
Source
DF Squares
Square F Value Pr > F
Model
<.0001
Error
Corrected Total
Parameter Standard
Variable Estimate
Error Type II SS F Value Pr > F
Intercept <.0001
age <.0001
waist <.0001
hips - <.0001
wt - <.0001
ht
<.0001
Bounds on condition number: 3.634, 51.955
-----------------------------------------------------------------------------------------------
Forward Selection: Step 6
Variable bust Entered: R-Square = 0.4807 and C(p) = 7.0000
Analysis of Variance
Sum of Mean
Source
DF Squares
Square F Value Pr > F
Model
<.0001
Error
Corrected Total
Parameter Standard
Variable Estimate
Error Type II SS F Value Pr > F
Intercept <.0001
age <.0001
bust -
waist <.0001
hips - <.0001
wt - <.0001
ht
<.0001
Bounds on condition number: 3.9451, 75.099
-----------------------------------------------------------------------------------------------
All variables have been entered into the model.
Summary of Forward Selection
Variable Number Partial
Model
Step
Entered Vars In R-Square
R-Square C(p) F Value
Pr > F
1
ht
<.0001
2
hips
<.0001
3
waist
<.0001
4
wt
<.0001
5
age
<.0001
6
bust
The REG Procedure
Model: MODEL1
Dependent Variable: year
Backward Elimination: Step 0
All Variables Entered: R-Square = 0.4807 and C(p) = 7.0000
Analysis of Variance
Sum of Mean
Source
DF Squares
Square F Value Pr > F
Model
<.0001
Error
Corrected Total
Parameter Standard
Variable Estimate
Error Type II SS F Value Pr > F
Intercept <.0001
age <.0001
bust -
waist <.0001
hips - <.0001
wt - <.0001
ht
<.0001
Bounds on condition number: 3.9451, 75.099
-----------------------------------------------------------------------------------------------
All variables left in the model are significant at the 0.1000 level.
| Back to the index |